
The average retail trader enters the market with a conviction and capital. Most lose the capital before they develop the conviction.
This article is not about entry strategies. It’s about a more important question: how much does it really cost to build a professional trading track record, and what do you get in return?
A clarification before we start: this article is about the management ratio (SCE), not about trading gains. The Darwinex Zero model doesn’t promise returns — the trader generates those. What the model does guarantee is scalability: earning the same 15% whether you manage €30,000, €500,000, or €1,500,000. The size of the capital is determined by your consistency and your strategy’s capacity. The fixed subscription doesn’t change.
1. The number that changes the conversation #
Before we get to industry statistics, one number deserves its own paragraph:
In Darwinex, only 56% of traders lose money. #
The CFD/forex industry reports between 74% and 89% of retail traders with losses, according to official regulatory data. In Darwinex, that number drops to 56% (as of May 2026).
This isn’t marketing copy. It’s the direct consequence of operating with virtual equity, a standardized risk engine, and continuous external auditing — three elements that discipline trading before any third-party money is at stake.
Does this mean there’s no risk in Darwinex Zero? No. If you choose to trade without a subscription — depositing a minimum of $500 / €500 / £500 with real capital — your money is at risk. And the industry statistics apply.
2. What the industry doesn’t put in the banner #
Regulatory bodies require CFD and forex brokers to disclose the percentage of retail clients who lose money. Here’s what they report:
| Regulatory source | % of retail traders with losses |
|---|---|
| ESMA (Europe) | 74% – 89% |
| FCA (United Kingdom) | ~80% |
| CNMV (Spain) | 70% – 90% |
| SEBI (India, futures & options) | 93% |
| CFTC (USA, forex) | 70% – 80% |
Not a geography problem. Not an asset class problem. A global pattern that concentrates in the first year.
80% of traders lose money in their first year. 58% lose the majority of their starting capital. 40% quit before the first month is over. 97% of those who trade for more than 300 days end up with net losses.
How much is typically lost? According to ESMA analysis of EU CFD accounts: between €1,600 and €29,000 depending on the trader’s profile and trading intensity.
That money doesn’t generate an audited track record. It doesn’t build an asset. It disappears — and takes the time invested with it.
The opportunity cost nobody calculates #
A trader with $5,000 in savings who decides to “try it out” for 12 months:
- 80% probability of losing a significant portion of those $5,000.
- That money could have been earning interest, sitting in an index fund, or simply preserved.
- At year end: no audited track record — just a personal history on a platform no one can independently verify.
The cost isn’t just financial. It’s opportunity cost.
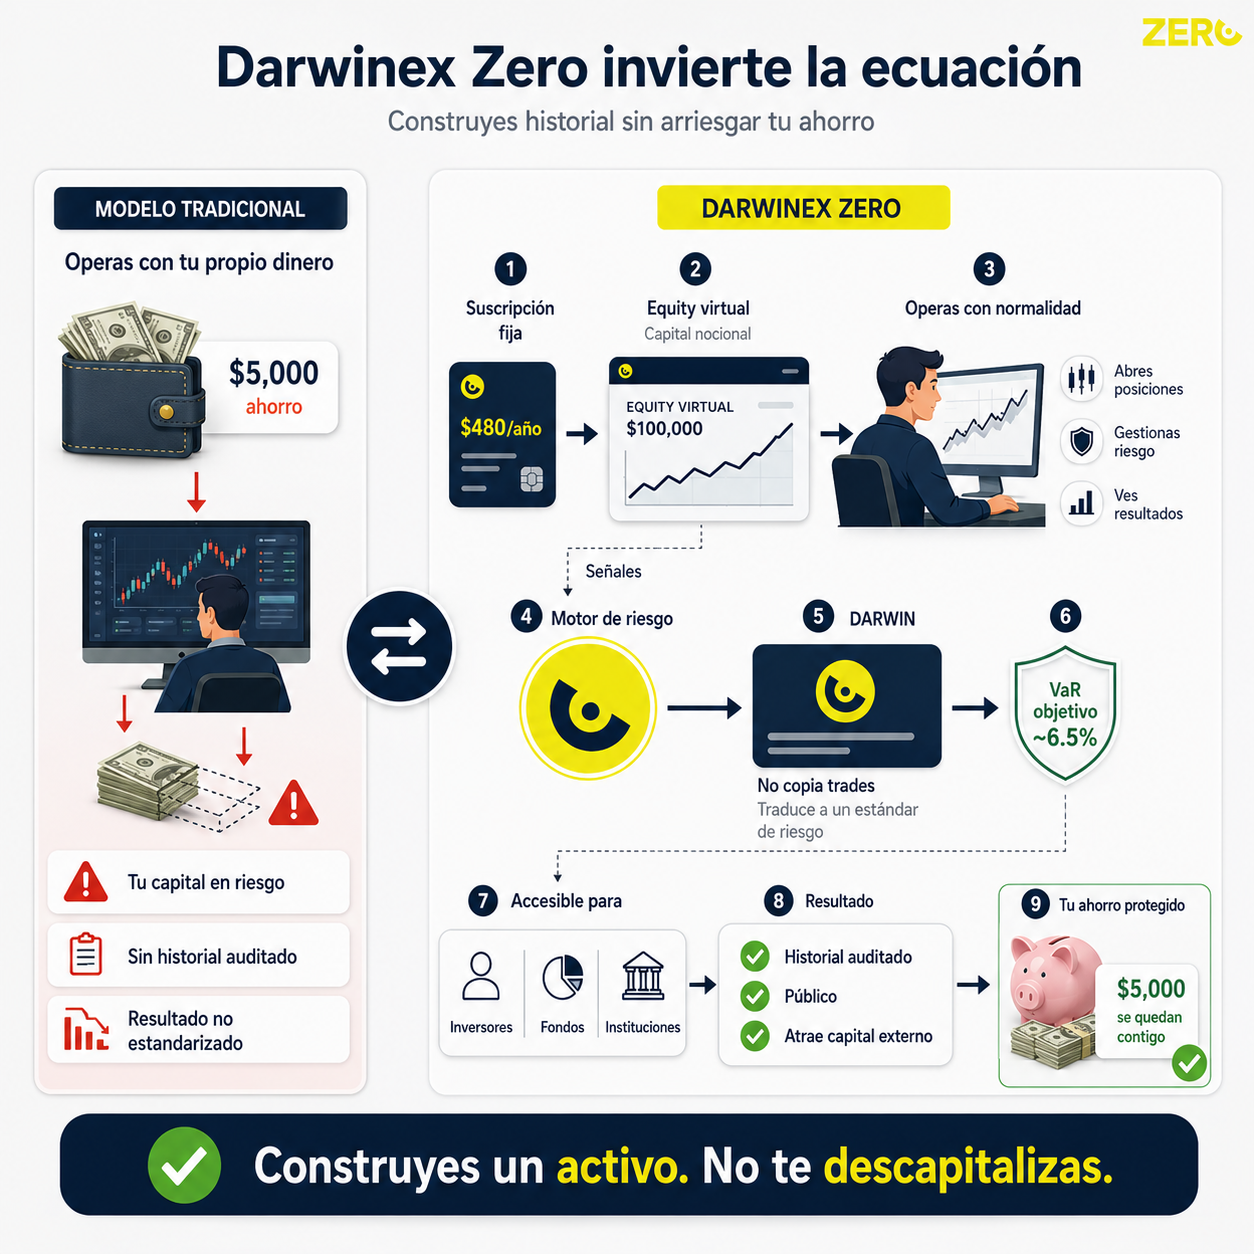
3. The logic of virtual equity #
Darwinex Zero inverts the equation. Instead of risking your capital while building a track record, you pay a fixed subscription ($480/year) and trade with virtual equity.
Your account uses notional capital — money that isn’t yours and that you don’t put up. Operationally it works exactly like a live account: you open positions, manage risk, see results. But that equity is data genesis: the source of signals that Darwinex’s risk engine reads, standardizes, and replicates onto the real capital of investors.
The engine doesn’t copy your trades literally. It translates them into a risk standard (target VaR ~6.5% for the investor) and executes them on the DARWIN — the investable asset you’re building.
What you do build: an audited track record verified by a regulated manager, publicly visible, capable of attracting capital from external investors.
Those $5,000 in savings can stay wherever they were.
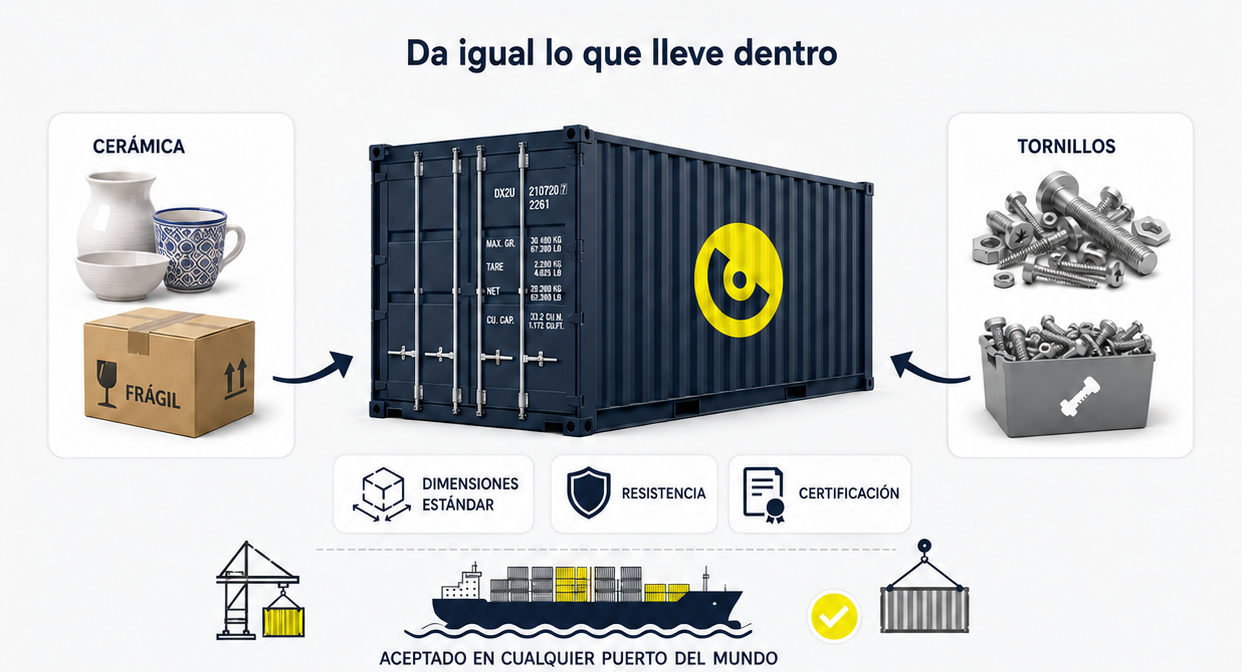
The idea of risk standardization can sound abstract. Let me illustrate it with two everyday analogies: #
The rental car speed limiter. You can be a brilliant driver or a reckless one — the vehicle won’t exceed 120 km/h. The passenger always knows the maximum risk of the journey. Darwinex’s engine does the same for investors: regardless of how you trade, their maximum exposure is capped (~6.5% drawdown). They know exactly what they’re buying.

The standard shipping container. It doesn’t matter whether you’re shipping fine ceramics or industrial bolts. The container has standard dimensions, resistance ratings, and certifications that any shipping company or port in the world understands and accepts. Your DARWIN is that container: the strategy inside can be anything, but the risk standard the engine projects is universal — understandable and comparable to any investor, fund, or institution worldwide.
VaR as the manager’s speedometer. The S&P 500 has the VIX — its own volatility index. When the VIX spikes, markets know uncertainty is high. DARWIN managers have their equivalent: VaR (Value at Risk). Your VaR reflects the real volatility of your strategy: how often you trade, how much leverage you use, and how much the assets you touch move. When that volatility spikes — an aggressive trading streak, a market moving out of range — Darwinex’s risk engine responds automatically: it reduces the replication size on investor capital to maintain the target VaR (~6.5% monthly at 95% confidence). The result: your trading may be going through a turbulent phase, but the investor’s risk stays controlled. Your strategy is protected from itself. The investor is protected from your worst moment. That’s what separates a DARWIN from an unfiltered copy-trading account.
4. The Subscription Capital Efficiency Ratio (SCE) #
Once the DARWIN starts attracting capital, a metric appears that doesn’t exist in any other trading model:
SCE = Capital under management / Total subscription paid
It measures how much capital you manage — or access through the ecosystem — per dollar invested in building that track record.
Calculation with real cases #
Three active DARWINs, all with DarwinIA GOLD active. Assumption: annual subscription ($480/year) from day one, no USD/EUR currency adjustment.
| Trader | DARWIN | Months | Annual payments | Total subscription | Capital under management | SCE |
|---|---|---|---|---|---|---|
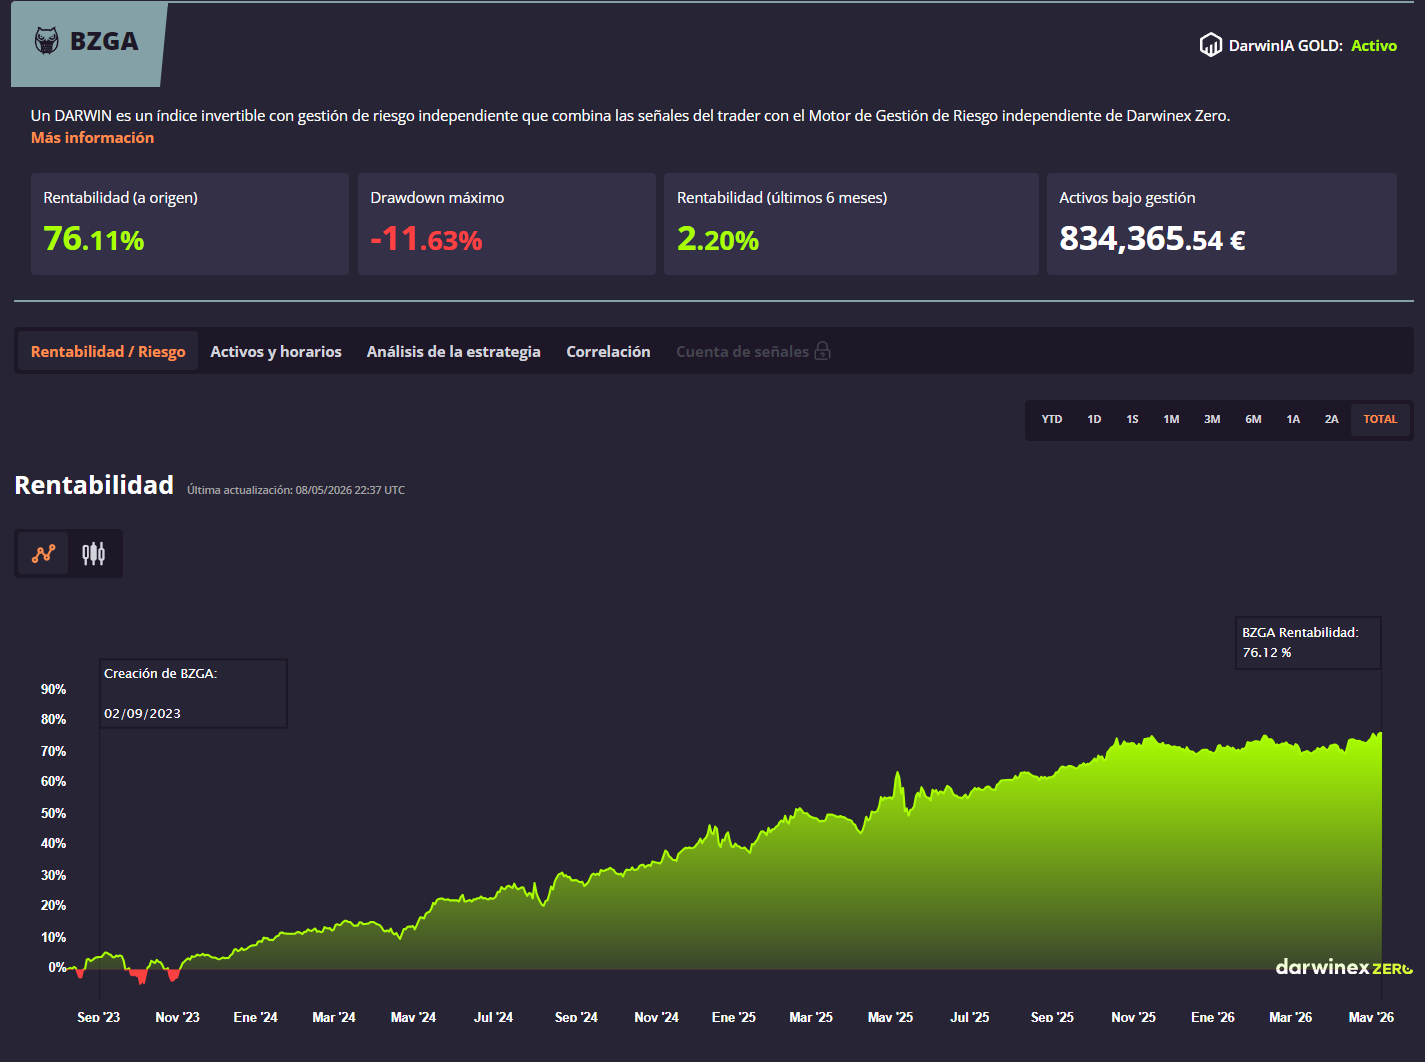
| César Sambrano | BZGA | 32 | 3 | $1,440 | €834,365 | ~579x |
| Dr. Deanna Cole | LWLU | 18 | 2 | $960 | €907,690 | ~945x |
| Albert Tost | DRME | 15 | 2 | $960 | €1,481,762 | ~1,544x |
Capital under management per public Darwinex Zero data as of May 2026.
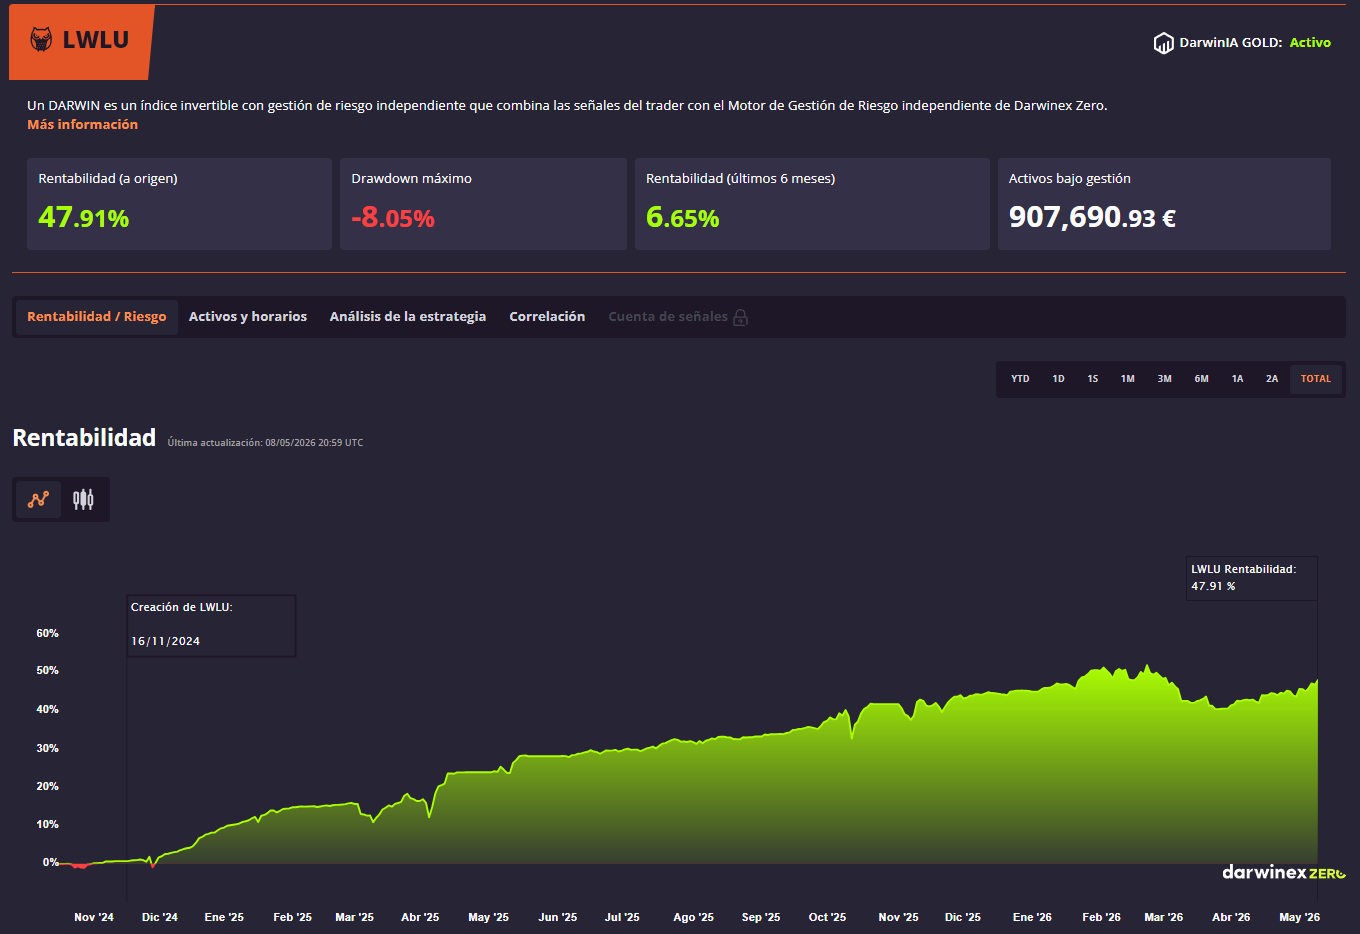
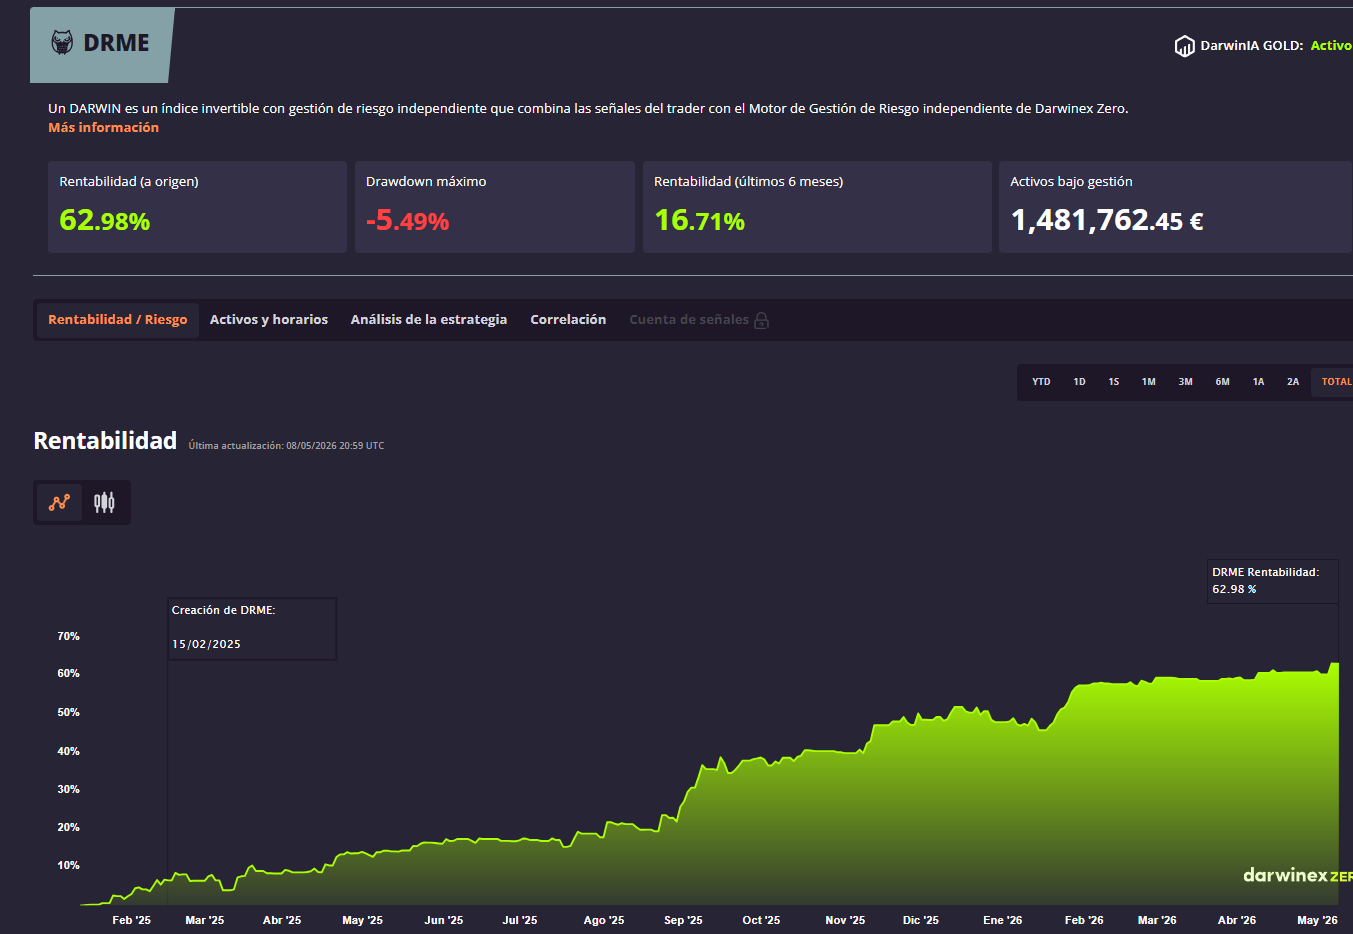
Albert Tost has been running 15 months. He’s paid $960. He manages €1,481,762. For every dollar paid: ~1,544€ under management.
Traditional access to investor capital requires company formation, regulatory compliance, external audits, institutional due diligence — entry costs of €30,000 to €50,000 before managing a single euro of outside money, assuming you already have the track record to present.
Here the entry cost is $960.
5. The fee structure: what separates a real business #
Two models, two opposing logics. #
The real hedge fund industry standard: 80% for the investor, 20% for the manager on profits. The investor is the center of the model; the manager earns by generating real returns on real capital.
Funded challenges invert that logic: 80% for the trader, 20% for the house. It sounds generous — until you realize there are no real investors, no capital that scales outside the firm’s sandbox, the rules are artificial (they don’t exist in real fund management), and the firm can revoke access at any time.
Darwinex follows the real Hedge Fund standard — with a three-way split:
| Party | % of profits |
|---|---|
| 🏦 Investor | 80% |
| 📈 Trader (you) | 15% |
| 🔧 Darwinex (infrastructure, compliance, regulation) | 5% |
The trader earns 15% — less than the HF standard 20%. But on capital from real investors in a regulated marketplace that can grow indefinitely on the same fixed subscription.
The 80% from a funded challenge might be 80% of €50,000 the firm assigns you today — and can revoke tomorrow. The 15% from Darwinex might be 15% of €1,481,762 that Albert Tost manages today, with real investors who chose his DARWIN on a regulated marketplace.
15% of a real market beats 80% of an artificial sandbox.
All allocation types — Silver, Gold, Boosters, direct capital — operate under the same independent High-Water Mark (HWM) standard per allocation. Each new allocation is, for all purposes, a new investor with their own entry point and their own watermark. Exactly how any real Hedge Fund operates: each investor has their own entry price and their own HWM.
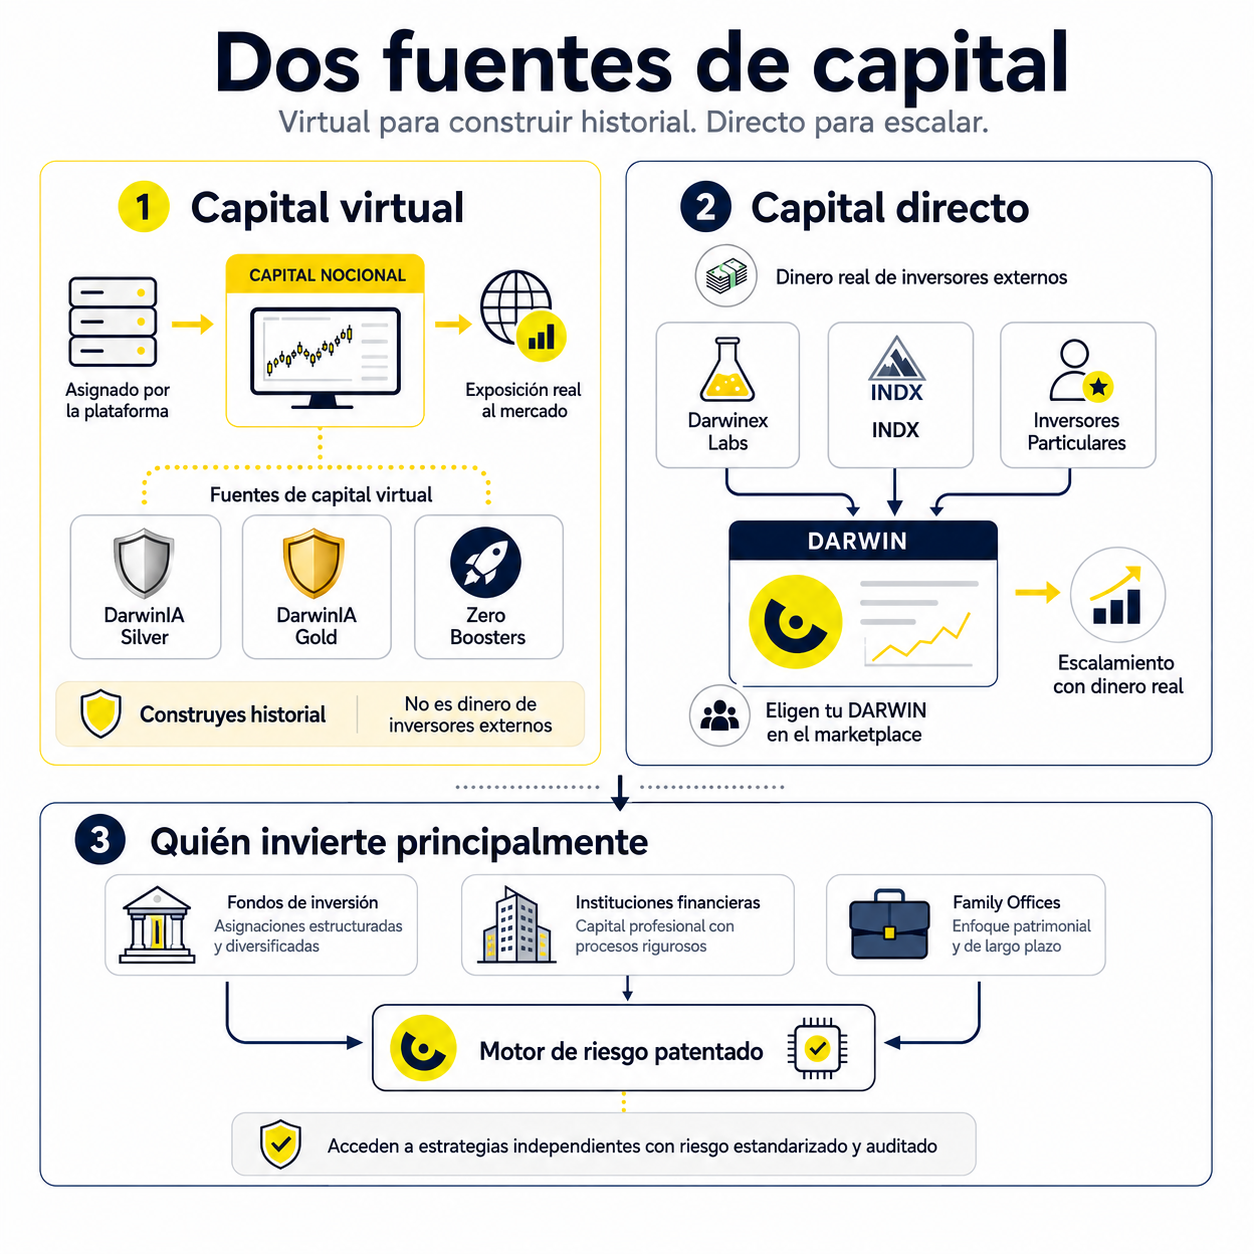
6. The 7 capital sources: virtual vs direct #
Capital sources in Darwinex Zero fall into two categories with distinct logic:
Virtual capital: allocated by the platform as notional capital. Not external investor money — platform capital used to build your track record with real market exposure. Sources: DarwinIA Silver, DarwinIA Gold, and Zero Boosters.
Direct capital: real money from external investors who choose your DARWIN on the marketplace. Sources: Darwinex Labs, INDX, and Private Investors.
The primary investor clients of Darwinex are other investment funds, financial institutions, and Family Offices that diversify risk using Darwinex’s proprietary risk engine to access independent strategies with standardized, audited risk profiles.
All allocations — virtual and direct — are cumulative. A DARWIN can simultaneously receive Silver + Gold + Boosters + private investor capital + INDX, each with its own independent HWM.
Comparison table: all 7 sources at a glance #
| Source | Type | Min. capital | Max. capital | Duration | Access condition |
|---|---|---|---|---|---|
| 🥈 DarwinIA Silver | Virtual | €30,000 | €250,000 | 3 months | Rating ≥75, auto-enrollment |
| 🥇 DarwinIA Gold | Virtual | €50,000 | €500,000 | 6 months | 8m+ history, R/DD ratio >2.5 |
| 🛡️ 6-Month Guarantee | Virtual | €30,000 | €30,000 | 3 months | No allocation for 6 months |
| 🚀 Zero Boosters | Virtual | €25,000 | €500,000* | 3m – 3y | Return target or immediate |
| 🧪 Darwinex Labs | Direct | — | No public limit | Variable | Internal Darwinex criteria |
| 📊 INDX | Direct | — | €1,000,000+ | Variable | Discretionary fund selection |
| 👥 Private Investors | Direct | — | No limit† | Ongoing | DARWIN active on Darwinex-Classic |
Maximum across all simultaneous active Boosters.
7. Each source in detail #
🥈 DarwinIA Silver — The first rung (automatic) #
As soon as you complete calibration and create your DARWIN, you’re automatically enrolled in DarwinIA Silver. No application. No additional fee.
Monthly capital is allocated via a ranking based on three criteria:
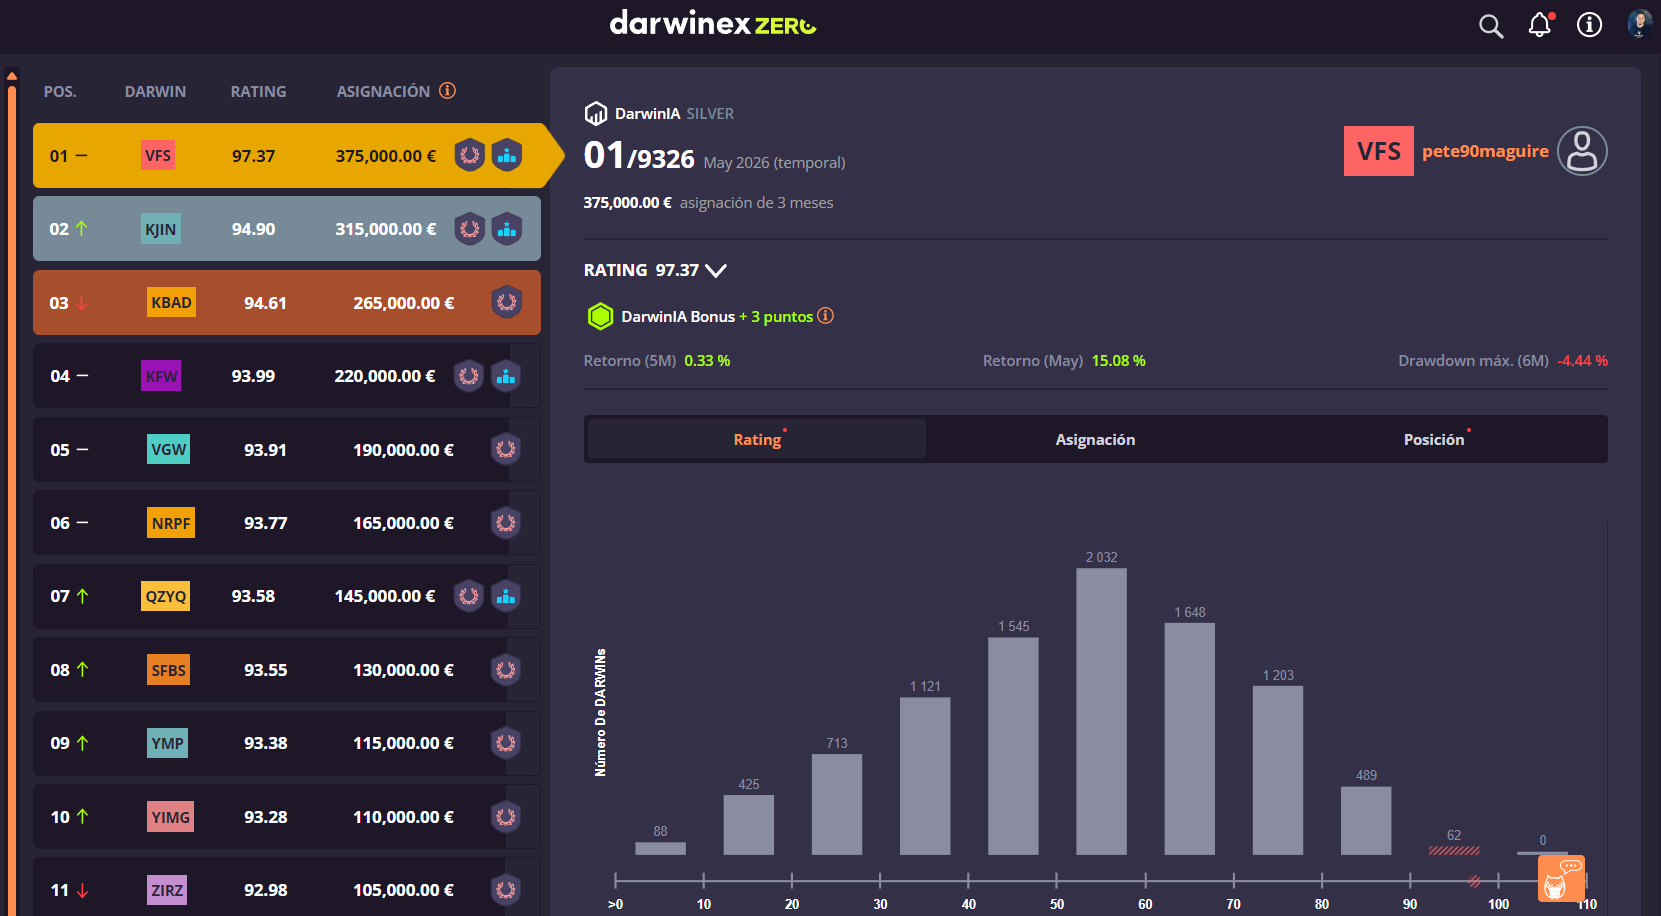
- Minimum rating of 75 → guaranteed minimum of €30,000
- Ceiling per DARWIN: €250,000 per 3-month period
- Commission: 15% on profits, calculated quarterly with HWM
The system rewards consistency over time (67% weight) above point-in-time monthly performance (22%). Drawdown acts as a ranking modulator (11%).
🔗 Learn more about DarwinIA Silver: Official site ↗
🥇 DarwinIA Gold — Sustained capital and investor access #
Requirements:
- More than 8 months of trading history
- Return / max drawdown ratio > 2.5, with one threshold met: +20% (1y) · +25% (2y) · +30% (3y) · +35% (4y) · +40% (5y)
- Correlation < 0.95 with other DARWINs
What does ~0.8% monthly actually mean?
The most representative Gold threshold (3 years, +30%) translates to just ~0.8% average monthly return — or roughly +10% per year, exactly the historical return of the S&P 500.
Consistently beating that level with an audited track record and real capital at risk isn’t just qualifying for Gold. It puts you in direct competition with active fund managers worldwide. According to the SPIVA Scorecard, 84% of active large-cap funds failed to beat the S&P 500 over the past 10 years — and 89.5% over the past 15. A trader who builds that track record on Darwinex isn’t just managing institutional capital — they’re competing in the same league as the world’s best fund managers.
Capital: €50,000 – €500,000 per 6-month period. Upon reaching Gold, the DARWIN becomes visible on Darwinex’s public marketplace for private investors.
This is the inflection point where SCE starts scaling consistently: Gold + Silver + Private investors accumulating simultaneously.
🔗 Learn more about DarwinIA Gold: Official site ↗
🛡️ The 6-Month Guarantee — The safety net #
If a DARWIN goes 6 consecutive months without receiving any allocation — for any reason, including drawdown — Darwinex guarantees a minimum €30,000 allocation for 3 months.
Not a reward. A signal that the ecosystem recognizes building a track record takes time — and no active trader should be left completely without exposure just for going through a difficult period.
The guarantee’s SCE in the worst-case scenario (assuming the user pays the monthly subscription, with no annual commitment):
Reference monthly subscription: €43/month. During the 3 guarantee months, the trader pays €43 × 3 = €129 — and manages €30,000 in notional capital.
Guarantee SCE = €30,000 / €129 = ~232x
The advantage: even in the absolute worst case — 6 months with zero allocation, curve in drawdown, no Silver or Gold — the model doesn’t leave you at zero. The guarantee puts you back in play with €30,000 in capital and a 232x SCE on what you paid that quarter. The track record keeps running. The engine keeps reading signals. The fixed subscription stays the same.
🚀 Zero Boosters — Capital you activate (and tactical strategy) #
Zero Boosters are notional capital allocations you purchase, conditioned on reaching a return target — or activated immediately. Pricing logic: higher target = lower Booster cost.
Four available sizes: €25,000 · €50,000 · €100,000 · €200,000, stackable up to €500,000 simultaneously, in durations of 3m, 6m, 1y, and 3y.
A relevant restriction: €25,000 only has immediate options — no access to conditional targets. Conditional targets are added by size: from €50,000 (5% at 3y only; 10% at 1y and 3y), from €100,000 adds 15% (at 1y and 3y) and 20% (at 3y only). The €200,000 size has full access to all targets and durations.
A Booster’s SCE is determined by the chosen target, not the capital size. Higher conditional target = higher efficiency per dollar:
| Target | Booster SCE (3-year reference) |
|---|---|
| Immediate | ~50x (same across all sizes) |
| 5% | ~91x |
| 10% | ~168x |
| 15% | ~253x |
| 20% | ~342x |
A notable pricing anomaly: the €100,000 Booster at 10% for 3 years costs exactly the same as the €50,000 one at the same target and duration ($595). For the same price, the €100k delivers double the capital — SCE ~168x vs ~84x. In that specific range, the larger size is the better buy.
Total simultaneous ceiling: €500,000 across all active Boosters.
When a Booster activates, its HWM is fixed at the DARWIN’s value at the moment of activation. From that point, the trader earns 15% on profits generated above that HWM — independently of the HWM on other allocations.
Advanced use: Boosters as a tactical tool #
A trader with statistical data on their strategy can use Boosters actively — not just to add capital, but to manage their commission position relative to the HWM.
The logic: when a DARWIN is in drawdown, the HWM on current allocations sits above the present value. Recovering that ground before earning commissions again takes time. A well-placed Booster sets a new HWM from the current level — the trader starts generating commissions on additional capital while the strategy recovers.
The three examples below use real DARWINs you already know from this article. Each includes the Booster SCE: booster notional capital divided by booster cost alone — an independent metric from the DARWIN’s base SCE. The two investments (subscription and booster) are evaluated separately.
Example A — BZGA (César Sambrano): €200,000 · 20% target · 3 years · $585
BZGA had its most pronounced drawdown in its early months after launch (Sept 2023), reaching -11.63% max around Oct–Nov 2023. The trader, with historical data on their strategy, knew +20% recoveries from lows were probable within a 12–18 month horizon.
- BZGA in drawdown: value ~91 (from starting 100)
- Booster purchased: €200,000 at 20% target, 3 years — cost: $585
- Activation: when BZGA reaches +20% from purchase date (value ~109)
- Booster HWM: fixed at ~109 upon activation
- From there: 15% on profits above 109 on €200,000 for 3 years
BZGA closed May 2026 at +76.11%. The booster activated. It has been generating commissions on €200,000 in additional capital — all for $585 invested at the worst point of the curve.
| Item | Value |
|---|---|
| Accumulated subscription (32 months · 3 annual payments) | $1,440 |
| Current AUM | €834,365 |
| Base SCE | ~579x |
| — | — |
| Booster cost (20% · 3y) | $585 |
| Booster notional capital | €200,000 |
| Booster SCE | ~342x |
The 20% conditional Booster is the cheapest of all — and has the highest Booster SCE (~342x): for every dollar spent, the trader accesses ~€342 of additional notional capital. For a trader whose statistical data shows their strategy reaches that target, it’s the most efficient booster per dollar invested.
Example B — LWLU (Dr. Deanna Cole): €200,000 · 5% target · 1 year · $1,380
(Note: the platform offers durations of 3m, 6m, 1y and 3y — there is no 2-year option. This example uses 1 year as the tactical duration.)
LWLU launched in November 2024 and recorded its maximum drawdown (-8.05%) in the first months of 2026. The strategy shows fast recovery: +47.91% in 18 months, with +6.65% in just the last 6 months.
- LWLU drawdown in 2026: value 97.37 (from 100)
- Booster purchased: €200,000 at 5% target, 1 year — cost: $1,380
- Activation: when LWLU reaches +5% from purchase (value ~102.24)
- Booster HWM: fixed at ~102.24 — slightly above the original HWM (100)
- Short duration (1 year): tactical play to capitalize on the expected recovery
The 5% target is the lowest threshold available. For a strategy that historically recovers quickly (as LWLU’s curve shows), this is the Booster that activates soonest and starts generating commissions on €200,000 additional capital with the least wait.
One clarification that connects to the SCE table above: this Booster’s ~145x exceeds the ~92x reference for 5% at 3 years. The difference is duration: 1 year costs $1,380 vs $2,180 for 3 years — shorter term, lower cost for the platform, better SCE per dollar paid. The trade-off: less time for the Booster to generate commissions.
| Item | Value |
|---|---|
| Accumulated subscription (18 months · 2 annual payments) | $960 |
| Current AUM | €907,690 |
| Base SCE | ~945x |
| — | — |
| Booster cost (5% · 1y) | $1,380 |
| Booster notional capital | €200,000 |
| Booster SCE | ~145x |
Example C — DRME (Albert Tost): €500,000 immediate · 3 years · $9,945
DRME is the opposite case: +62.98% in 15 months, max DD of only -5.49%, and +16.71% in the last 6 months alone. The curve is near its historical HWM. There’s no drawdown to manage — there’s momentum to capitalize on.
For €500,000 immediate, three Boosters are stacked (platform allows up to €500,000 total simultaneously):
- 2 × €200,000 immediate · 3 years = 2 × $3,975 = $7,950
- 1 × €100,000 immediate · 3 years = $1,995
- Total stack cost: $9,945
Being immediate, all three activate upon purchase. Each Booster’s HWM is set at DRME’s current value — near the historical peak. The trader starts generating commissions on €500,000 in additional capital from day one, with no target to wait for.
| Item | Value |
|---|---|
| Accumulated subscription (15 months · 2 annual payments) | $960 |
| Current AUM | €1,481,762 |
| Base SCE | ~1,544x |
| — | — |
| Booster stack cost (2×€200k + 1×€100k · immediate · 3y) | $9,945 |
| Booster stack notional capital | €500,000 |
| Booster SCE | ~50x |
Immediate Boosters have the lowest Booster SCE (~50x) — they’re the most expensive per unit of capital. The trade-off is that there’s no target to wait for: commissions on €500,000 in additional capital from day one, with the HWM set at the current value. For a strategy with 15 months of clean equity curve and +62.98%, the question isn’t whether the booster is efficient in SCE — it’s whether the strategy’s consistency justifies starting to earn commissions on €1.98M in total capital tomorrow.
The pattern across all three examples:
| DARWIN situation | Booster type | Booster SCE | Logic |
|---|---|---|---|
| Deep drawdown, statistically probable recovery | High conditional (20%) | ~342x | Lowest cost, activates on recovery, optimal HWM |
| Drawdown in 2026, fast recovery expected | Low conditional (5%) · 1y | ~145x | Activates fast, captures recovery momentum |
| Near HWM, solid strategy | Immediate, maximum capital | ~50x | Commissions from day 1, no target to wait for |
LWLU’s ~145x exceeds the ~92x reference for 5% at 3 years because of the shorter duration (1y vs 3y): $1,380 vs $2,180 — same target, less time, lower cost.
When does an immediate Booster make sense? #
The relevant question isn’t “immediate or conditional?” It’s: how much does the first tranche of commissions I forfeit with a conditional actually cost?
A 20% conditional on €200,000 activates when the DARWIN reaches value 120. The HWM is set at 120. The trader earns no commissions on the first 20% of gains on that capital — 15% × €200k × 20% = €6,000 uncollected. The savings vs the immediate is ~$3,390. They’re comparable.
An immediate Booster at launch sets the HWM at value 100 — the absolute floor. Every point of gain from day one generates commissions. It’s the most favorable HWM that allocation will ever have.
It makes sense when these three conditions hold:
- Expected returns consistently exceed 15–20% annually — the extra cost of the immediate is recovered in the first months of commissions.
- The strategy is systematic and well-defined — not based solely on backtest without out-of-sample validation.
- The trader understands that Darwinex’s Risk Engine may reduce position sizes vs the backtest, shifting the live return profile from what was simulated.
If only backtest data exists: consider building 3–6 months of live track record first. If live results validate the backtest, the immediate makes full sense — and the HWM you set then is still lower than what you’d set after a long winning run. If there’s divergence from the backtest, the booster capital is exposed to a strategy that hasn’t yet proven it works under the real engine.
The DRME case illustrates the ideal scenario: 15 months of clean live equity curve, +62.98%, near the historical HWM. That’s not a backtest — it’s audited evidence. When that exists, the immediate is the logical decision.
Using Boosters as a tactical strategy is completely optional. It’s not mandatory for operating on the platform. It’s a tool for traders who already have statistical data on their strategy and want to optimize their commission position. Without that own data, the decision is speculative.
🧪 Darwinex Labs — Darwinex’s internal validation #
Darwinex Labs is Darwinex’s research and internal selection team. It can discretionally allocate capital to DARWINs meeting specific undisclosed analytical criteria. The least predictable source — and the one reflecting the highest level of institutional confidence in a strategy.
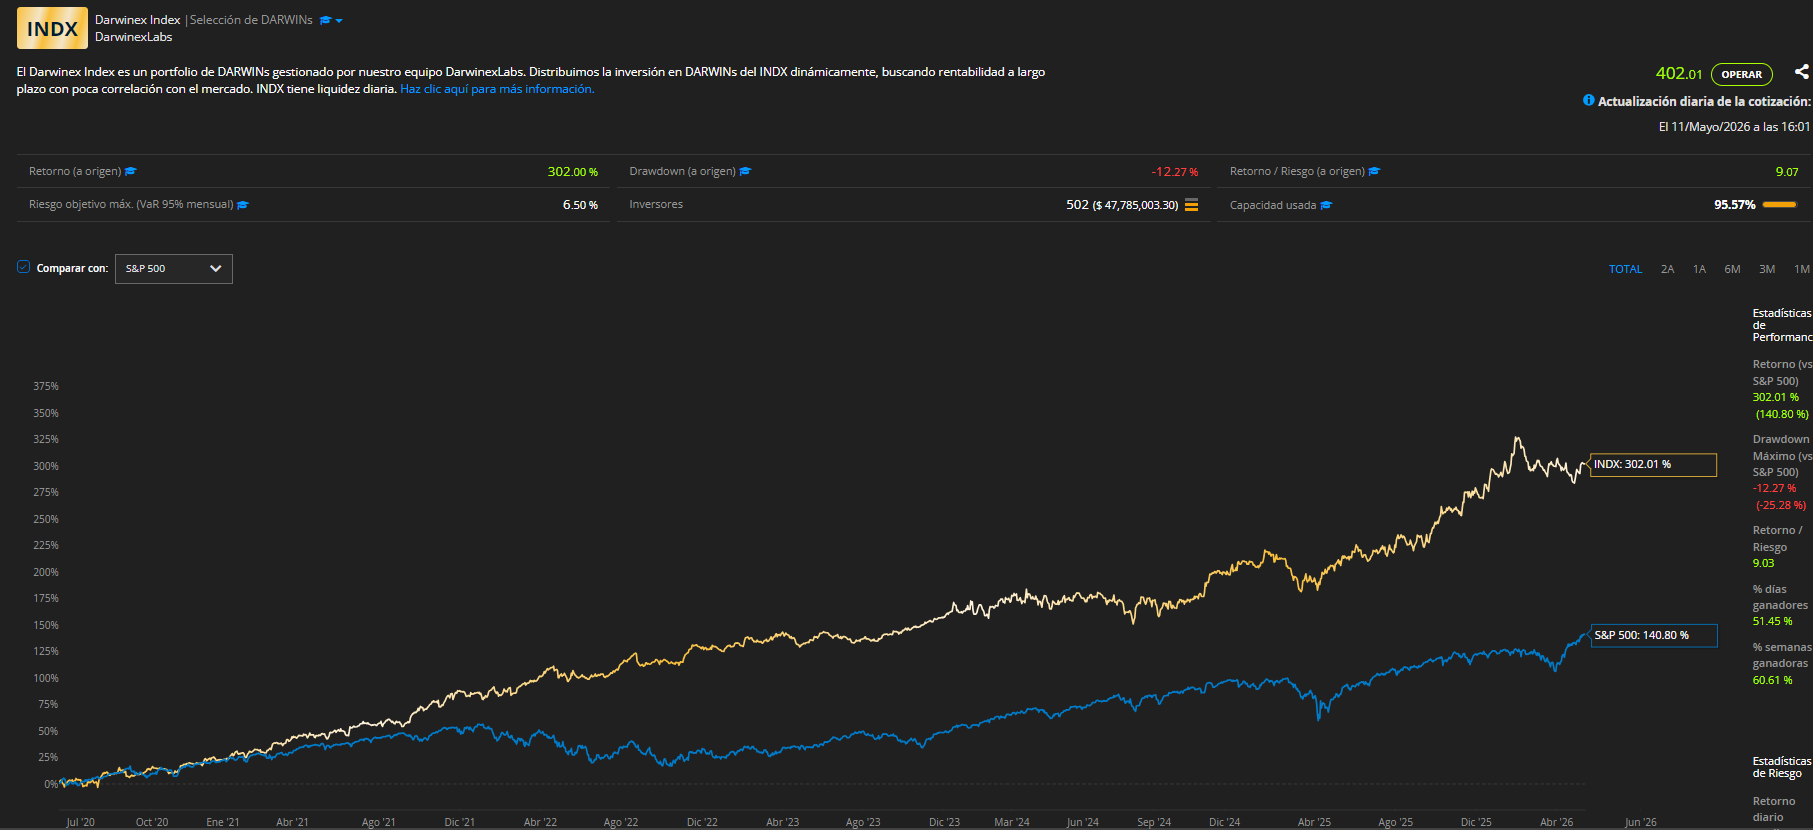
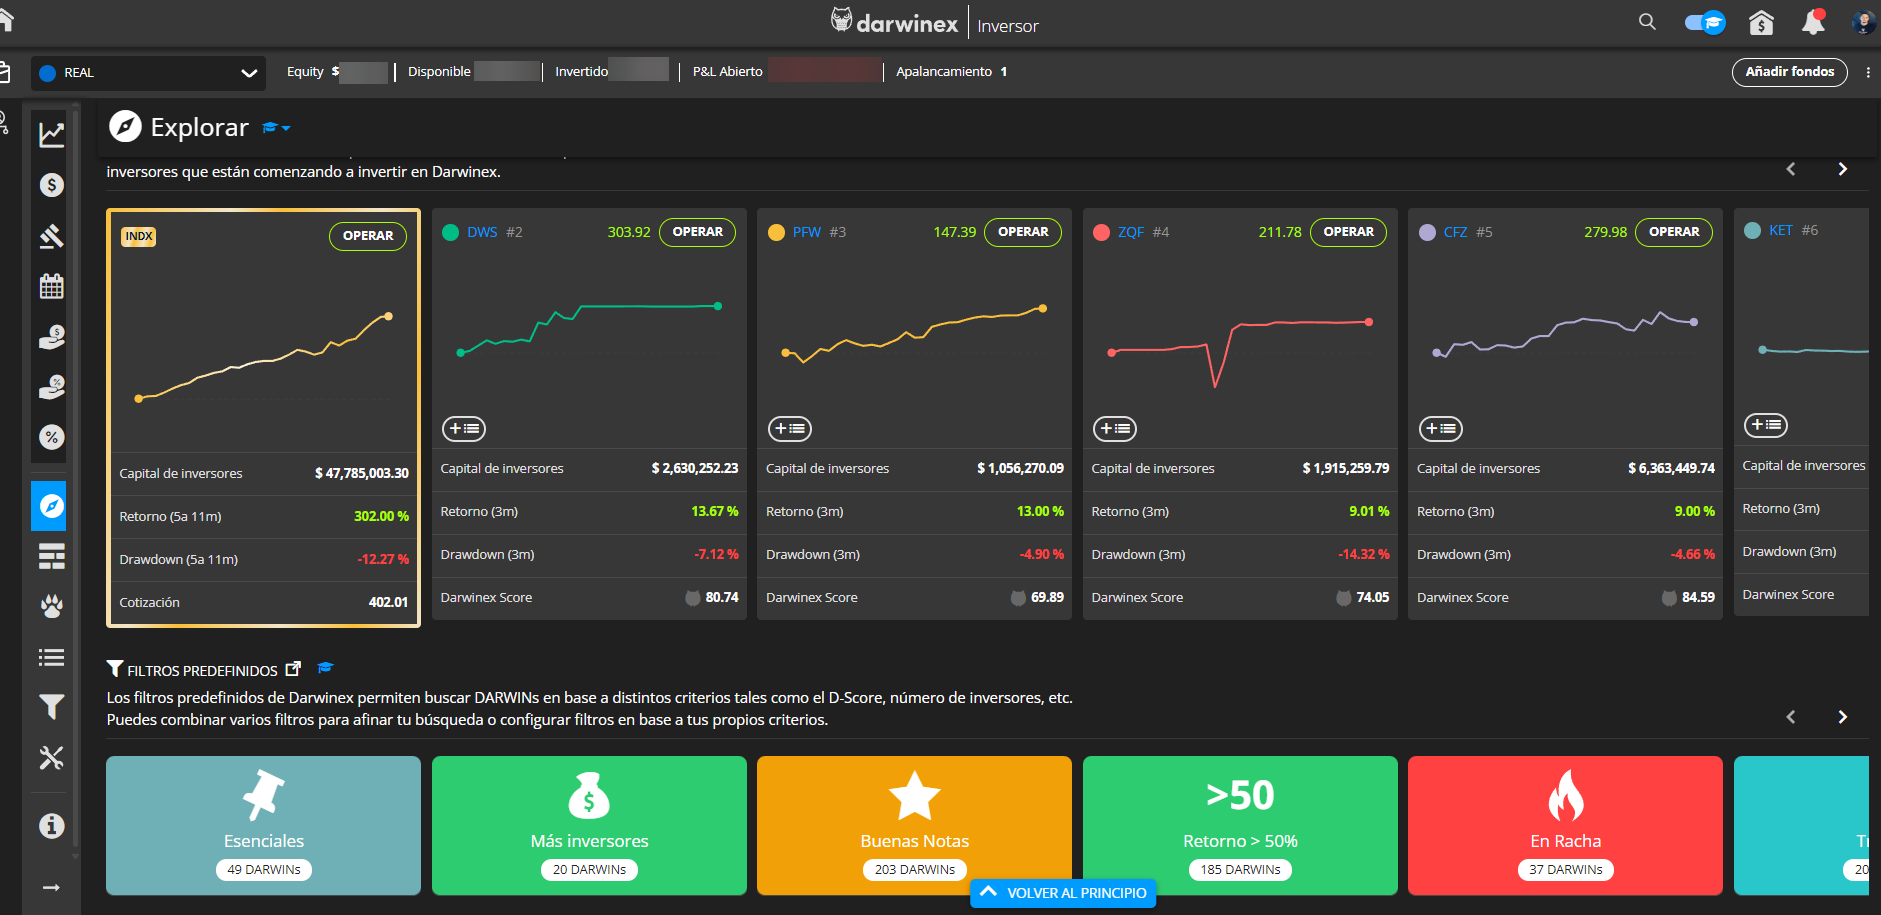
📊 INDX — The mark of the best #
INDX is a fund of DARWINs managed directly by Darwinex (led by co-founder Javier Colón). Not an automatic ranking — a discretionary selection of the most solid strategies in the ecosystem.
Being included can mean access to capital exceeding €1,000,000 per DARWIN. The €10,000 minimum and qualified investor requirement apply to those who invest in the fund — not to the trader. For the trader, the only requirement is to be selected.
And that is precisely what sets it apart: INDX is an indelible mark of belonging to the world’s best trading talent. It cannot be applied for or purchased. The criterion is singular — real consistency verified over time, not point-in-time performance.
👥 Private Investors — Market capital #
Once your DARWIN is active and visible on Darwinex-Classic, any investor on the marketplace can allocate capital directly — funds, Family Offices, financial institutions, and qualified individuals. DarwinIA Gold is not a strict requirement, though Gold significantly increases visibility and acts as a quality seal that makes capital attraction easier.
No theoretical market limit. Capital grows based on how much investors decide to allocate, driven by your auditable track record. The three DARWINs referenced in this article (BZGA, LWLU, DRME) manage between €834k and €1.48M partly through this channel.
One important clarification: the capital a strategy can manage is not unlimited in absolute terms — it is bounded by the Capacity (CP) attribute of each strategy. CP reflects the liquidity and maximum volume a strategy can absorb before the risk engine degrades replication quality. The higher the liquidity and scalability of the strategy, the higher the achievable AUM.
8. Scalability in numbers #
The subscription cost doesn’t change when your capital under management grows.
$480/year managing €50,000. $480/year managing €1,500,000. Same bill.
The only thing that scales is your track record. Not your infrastructure invoice, not your legal team, not your compliance structure. All of that is absorbed by Darwinex with the 5% it retains from the performance fee.
For the retail trader with a working strategy but no access to external capital: this is the difference between continuing to trade $5,000 of your own money with an 80% chance of loss — and building an audited financial asset that can scale to six or seven figures in capital under management at the same annual cost.
9. The honest calculation #
The SCE is not a magic number. It has conditions:
- It requires consistency. A DARWIN without a solid track record doesn’t attract capital. BZGA, LWLU, and DRME’s numbers are the result of months of disciplined trading.
- The commission is 15% on profits from allocated capital. No profits = no payment — and no income.
- Virtual equity can’t be withdrawn. Its function is to generate signals, not accumulate available balance.
- Timeframes matter. Silver allocates for 3 months. Gold for 6. Consistency sustains and grows successive allocations.
With that clear, the relevant question isn’t “does this work?” — the public DARWINs answer that. The question is: does your strategy have the consistency to sustain an audited track record for 12, 18, 24 months?
If yes, or if you’re working toward it, the model makes sense. If you don’t know yet — the virtual equity lets you find out without risking the capital you’d statistically lose in 80% of cases trading on your own.
Does this make sense for you? #
If you want to explore whether your trading has the conditions to incubate a DARWIN, I can do a review with you — no cost, no commitment.
- 📅 Book a session: Reserve here
- 🔗 LinkedIn: linkedin.com/in/nathantradeus
- ✉️ Email: nathanael.canon@darwinexzero.com
You can also visit the full Darwinex Zero page.
📚 Sources and references #
Statistical data on retail trader losses cited in this article come from the following regulatory and academic sources:
Official regulatory sources:
-
ESMA — European Securities and Markets Authority. Retail trader loss data for EU CFD products (74-89%). Published as part of retail investment product intervention measures.
ESMA agrees to prohibit binary options and restrict CFDs to protect retail investors -
FCA — Financial Conduct Authority (UK). ~80% of retail CFD traders with net losses. CFD restriction policy for retail clients (PS19/18).
PS19/18: Restricting contract for difference products sold to retail clients -
CNMV — Comisión Nacional del Mercado de Valores (Spain). 82% of CFD clients in Spain incurred losses (2015-2016). Consistent with broker reports under ESMA mandate.
CNMV Resolution on CFDs -
SEBI — Securities and Exchange Board of India. “93% of Individual Traders Incurred Losses in Equity F&O between FY22 and FY24.” Aggregate losses exceeding ₹1.8 lakh crore over 3 years. Official press release, September 2024.
SEBI Press Release — September 2024 -
CFTC — Commodity Futures Trading Commission (USA). 70-80% of retail forex traders with losses, reported by regulated brokers under CFTC rules (Rule 5.5).
Foreign Currency Trading — CFTC
Academic studies:
-
Barber, B.M., Lee, Y.T., Liu, Y.J., Odean, T. (2009). “Just How Much Do Individual Investors Lose by Trading?” Review of Financial Studies, Vol. 22, No. 2, pp. 609–632. Long-term analysis of net losses by active individual investors.
Oxford Academic — Review of Financial Studies -
Bogousslavsky, V. & Muravyev, D. (2025). “An Anatomy of Retail Option Trading.” Analysis of aggregate retail options losses exceeding $2 billion (2019-2021).
SSRN Working Paper
Active management vs. indices:
- S&P Dow Jones Indices — SPIVA U.S. Scorecard (Year-End 2024). 84.34% of active large-cap funds failed to beat the S&P 500 over the past decade; 89.50% over 15 years.
SPIVA U.S. Year-End 2024
Hedge fund industry standards:
-
Investopedia. The “2 and 20” structure — 2% annual management fee on AUM + 20% performance fee on profits — the historical standard of the hedge fund industry.
Two and Twenty — Investopedia -
CFA Institute UK. Position paper on fee structures and compensation in alternative asset management, including the “2 and 20” model, hurdle rates, and high watermarks.
Fees and Compensation — CFA Institute UK (2013)
Official documentation:
- Darwinex Zero — Official Documentation. Knowledge base with detailed guides on how the platform works, DARWIN attributes, DarwinIA, Boosters, and all ecosystem mechanics.
Darwinex Zero Official Documentation
Honorary references:
The DARWINs presented as real cases in this article are managed by traders with verifiable track records on the Darwinex Zero marketplace:
- César Sambrano — DARWIN BZGA · LinkedIn ↗
- Dr. Deanna Cole — DARWIN LWLU · X / Twitter ↗
- Albert Tost — DARWIN DRME · LinkedIn ↗