
Delta Zones offers a statistical read of buy/sell pressure based on price behavior, with alerts and a simple visualization in TradingView. It does not require level-2 data or footprint charts.
🚀 Update — v6 #
HTF Boxes: the most requested feature. Finally here. #
How many times did you want to trade 5m with H1 zones visible in the same chart, without juggling windows? Now you can.
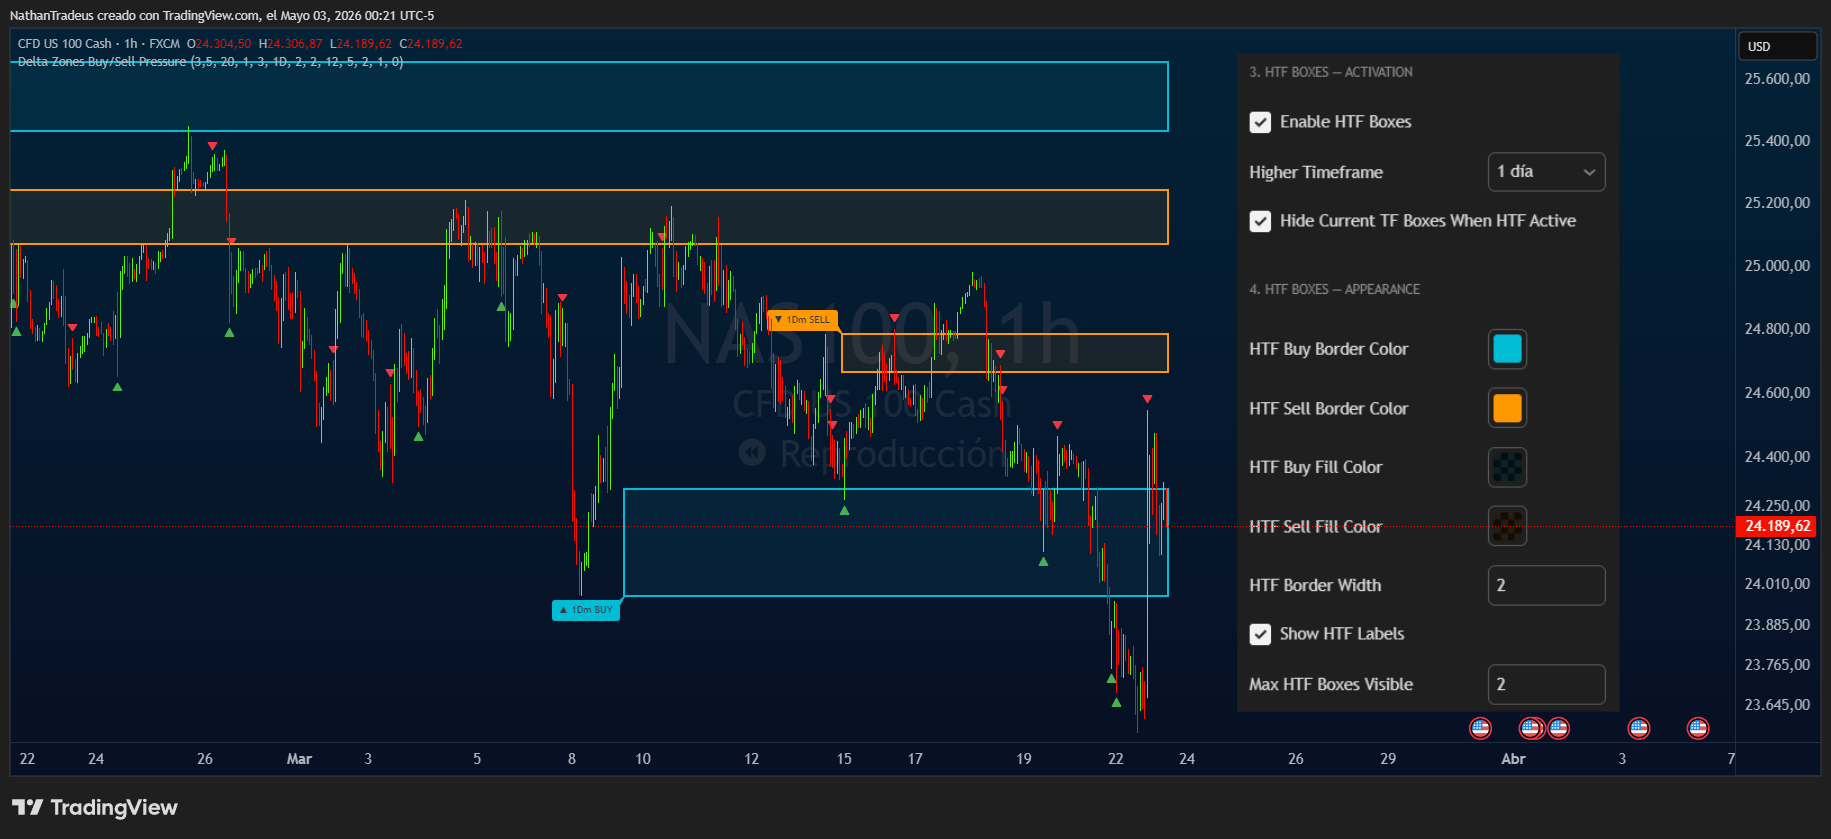
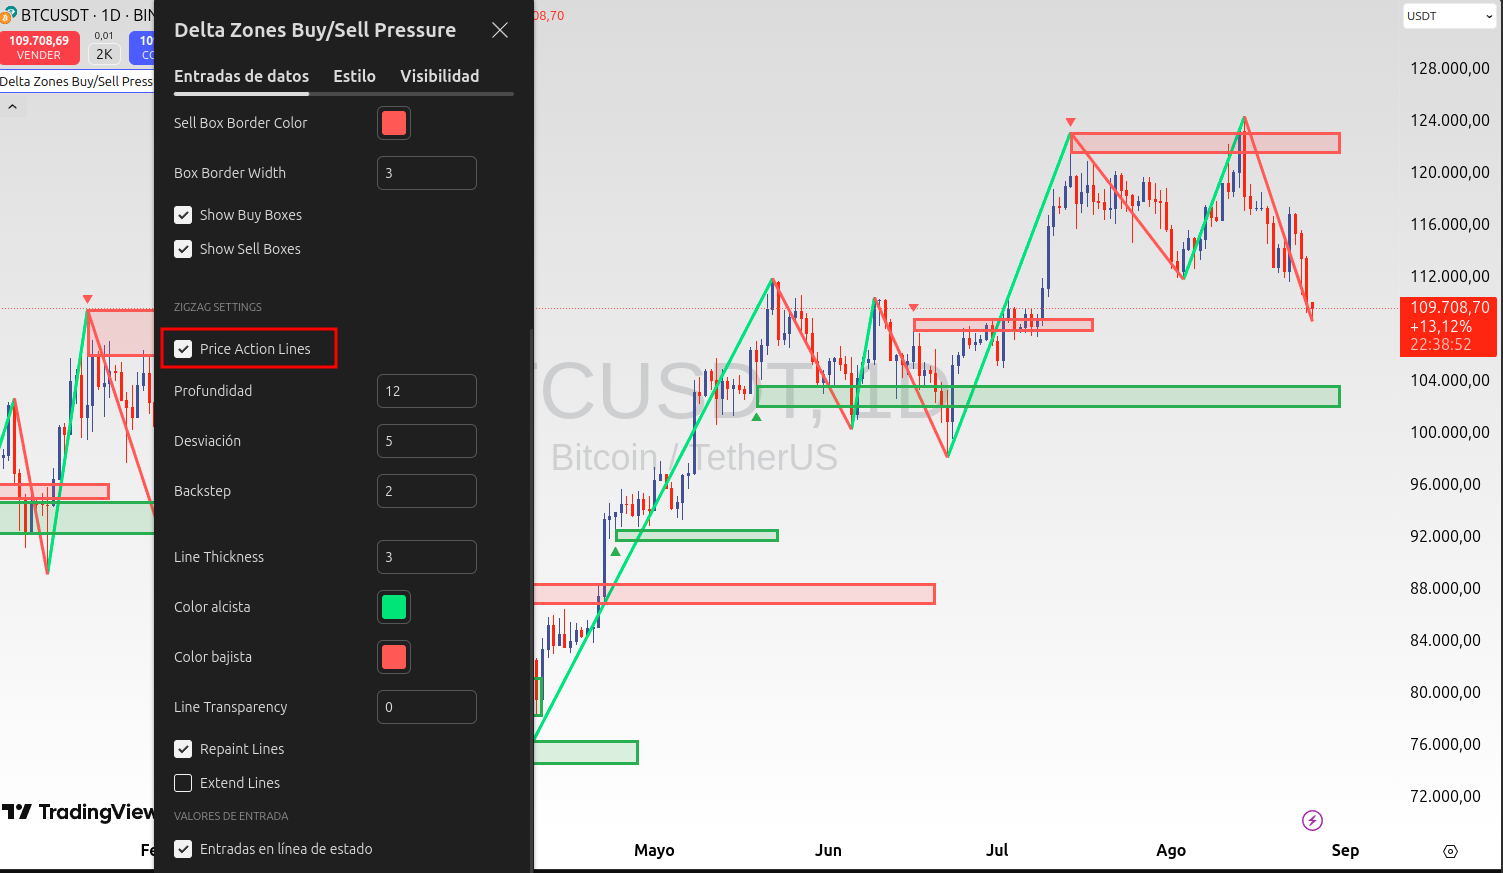
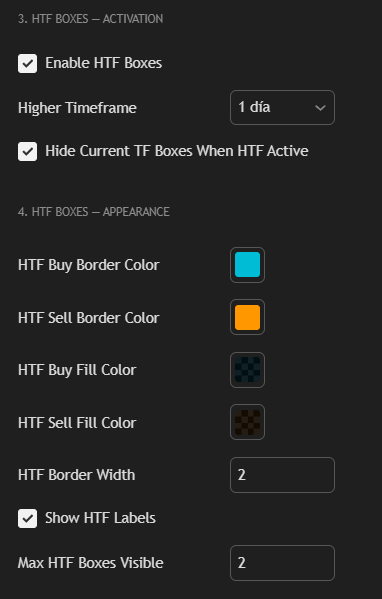
Enable HTF Boxes, select the higher timeframe, and its pressure zones appear overlaid directly on your current chart — with a differentiated design (thin fill, thick solid border) so you never confuse them with zones from the timeframe you’re actually trading.
HTF zones form far less often than current-TF zones. That means you can see structure from days or weeks back directly on your 5m or 15m chart. Real confluencing, no window switching.
More in this version:
- Max Boxes — decide how many zones stay visible at once. Fewer boxes on screen = more history visible further back. With 1–3 boxes, the slots are distributed across a much longer lookback.
- Auto-deletion — a buy box disappears on its own when price closes below it; a sell box, when price closes above. The chart cleans itself.
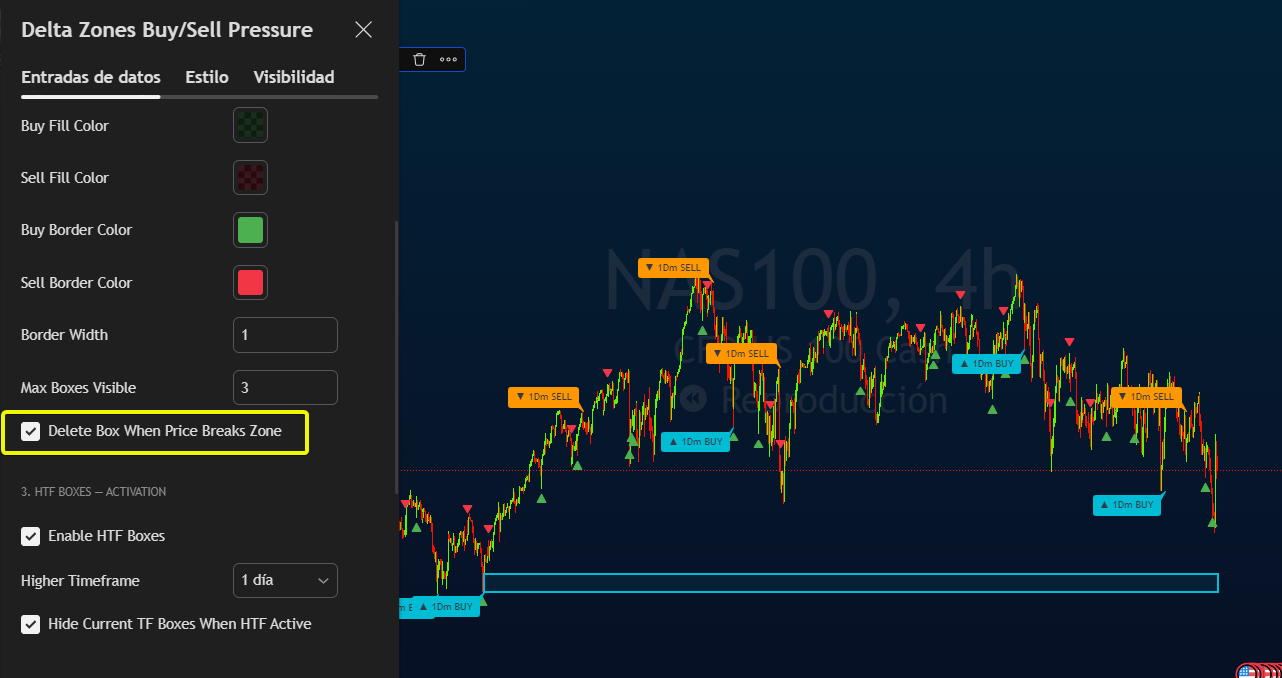
- Menu reorganized into 5 numbered groups — Delta Zones General, Current TF Boxes, HTF Boxes Activation, HTF Boxes Appearance, ZigZag. No hunting around.
- Rebuilt in Pine Script v6 from scratch, with array-based zone management: before, only the most recent box survived and TradingView quietly deleted the old ones. That’s gone now.
🔹 Introduction #
In professional environments, Order Flow allows reading the aggressiveness of buyers and sellers using depth data (DOM) and volume at each price level. Access, however, is often costly and demands data infrastructure.
Delta Zones was built around one concrete idea: detect unusual imbalances (buy/sell) with tools available in TradingView, without costly infrastructure.
🧭 Background & origin (my experience) #
In October 2023, during a free afternoon, I started prototyping an automatic way to draw rectangles in historical price areas that would highlight anomalous, disruptive, and—above all—objective buy/sell pressure. The idea came after months of manually drawing these rectangles where I observed unusual imbalances and clear price reactions.
The starting point was the Wick Delta Buy/Sell Pressure indicator by @scarf —original script: link.
My manual workflow was simple and repeatable:
- Add @scarf’s indicator.
- Filter only the outstanding bars (red or green).
- In the wick area, mark a 50% rectangle projected to the right.
- Always contextualize with the asset’s macro structure: identify trend, model, or consolidation in higher timeframes.
- Use these areas to look for favorable entries or, in extended trends, detect exhaustion, with buyers/sellers potentially trapped.
Under that logic, Delta Zones was built as an attempt to automate that process to make it more consistent and less subjective. I later added the ZigZag option to highlight impulses and pullbacks, so I can quantify swings and review historical pivots/rejections more quickly.
This indicator does not aim to replace your core analysis; it is designed to complement it. That said, it could become the basis of a system if you define clear rules and manage risk properly.
Inspired by @scarf’s work, I built a visual tool that automates that process and today has solid traction in the TradingView community.
⚙️ How it works #
-
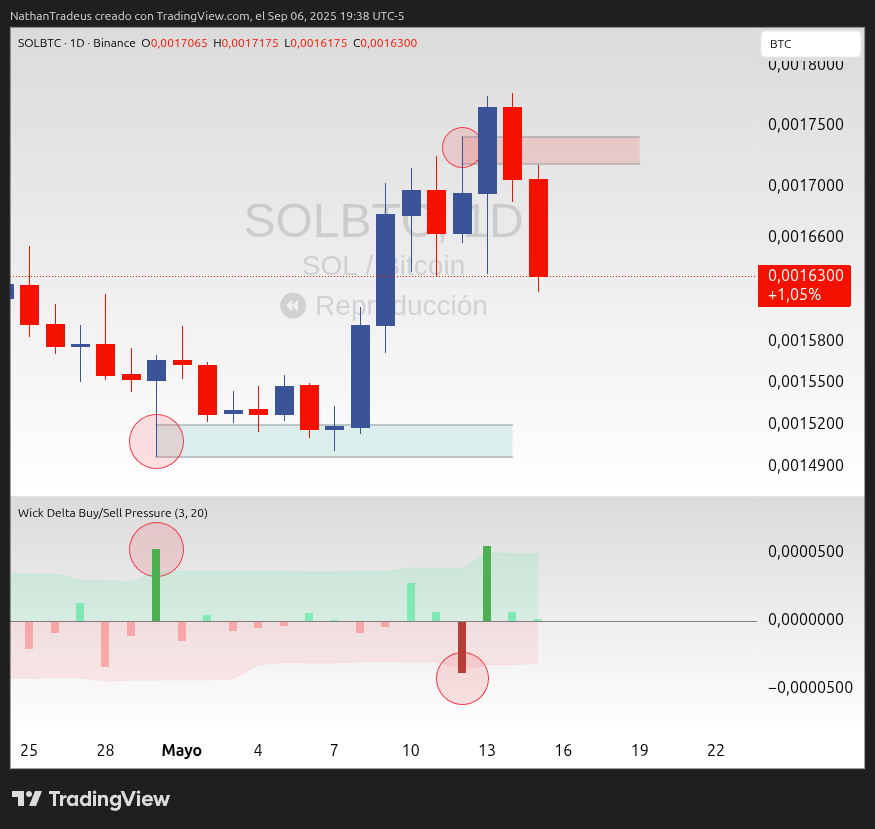
Delta calculation: From each candle’s structure (body and wicks), the indicator estimates positive delta (buy pressure) and negative delta (sell pressure).
-
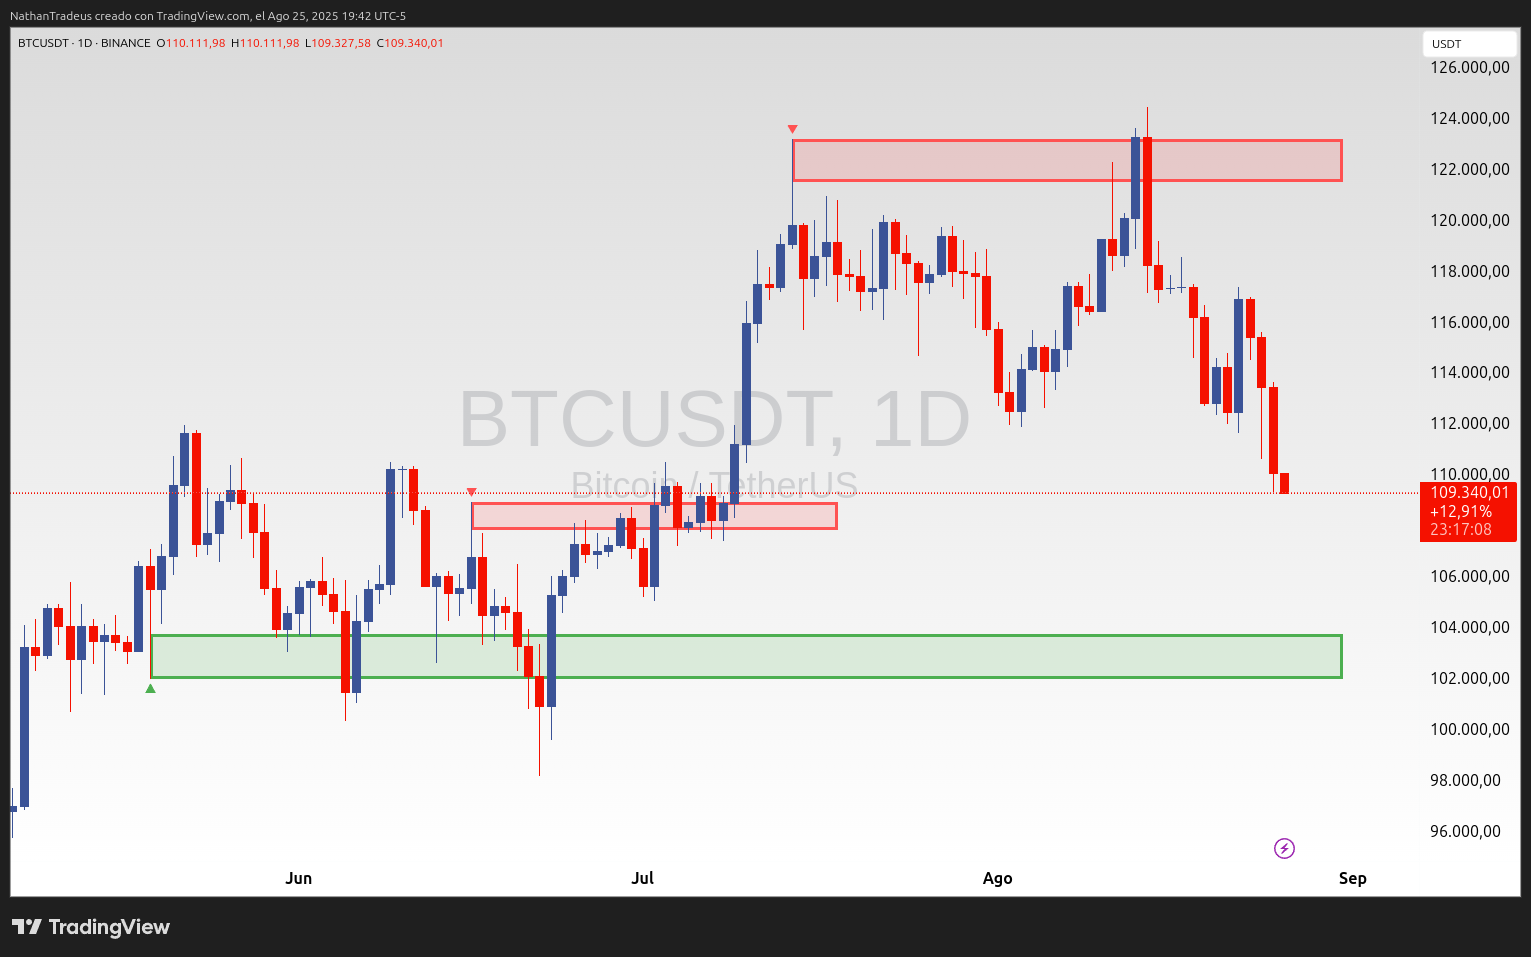
Standard deviations: With a configurable window (lookback) and a multiplier, it flags outliers—deltas that exceed statistical thresholds—which form zones:
- Green box → Buy pressure.
- Red box → Sell pressure.
-
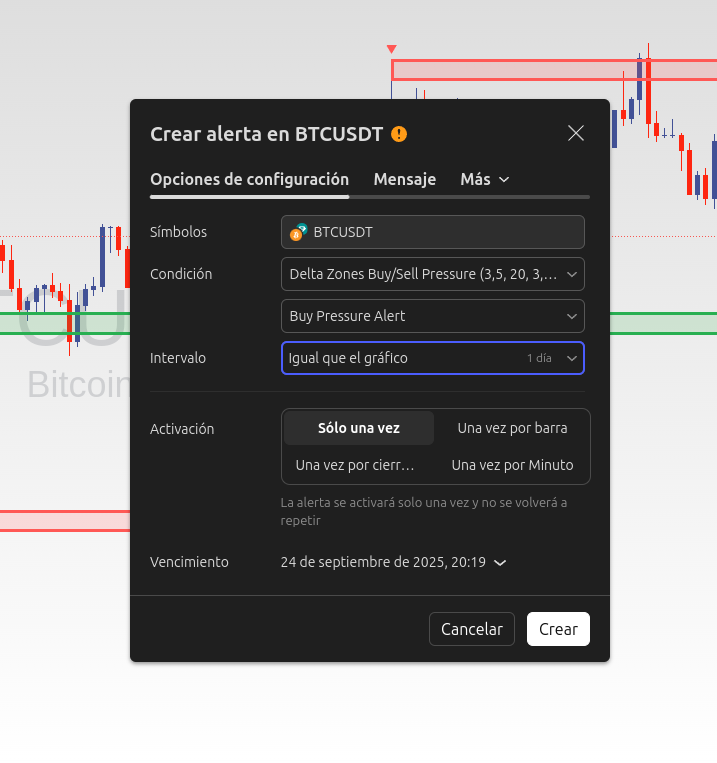
Zones, arrows, and alerts: Zones are drawn as boxes on the chart, together with up/down triangles and ready-to-use alerts.
-
Optional ZigZag integration: The ZigZag module helps contextualize swings and market structure, useful to confirm breakouts, pullbacks, and areas of interest.
📡 HTF Boxes — Multitimeframe confluencing in one chart #
This is the most-requested feature since the first version. The idea is simple: instead of opening another chart to see H1 zones while you trade 5m, you bring them directly to the chart you’re already on.
How to enable it:
- Open the indicator’s settings.
- Go to the HTF Boxes → Activation group.
- Enable “Enable HTF Boxes”.
- Select the Higher Timeframe — it must be strictly greater than the current chart’s TF. If you select one equal or lower, the indicator silently ignores it.
Key options:
- Hide current-TF boxes when HTF is active — enabled by default. Shows only the higher-TF zones to avoid cluttering the chart. Pressure arrows still appear on each candle; zones are hidden, signals are not.
- Differentiated appearance — HTF boxes have thin fill and thick solid border. At a glance you know which is which.
- Max Boxes (HTF) — same as for the current TF: controls how many HTF zones stay visible. HTF zones appear far less frequently, so with just a few boxes you can see weeks of structure directly on your 5m or 15m.
Recommended starting combinations:
| Active chart | HTF selected | Purpose |
|---|---|---|
| 5m | 15m or H1 | Intraday entries with confluencing |
| 15m | H1 or H4 | More selective scalps |
| H1 | H4 or D1 | Swing with daily context |
If you want to see both timeframes at the same time, disable “Hide current-TF boxes.” The chart can get busy, but you have full control over colors and Max Boxes for each group independently.
🔧 Timeframe suggestions (starting points) #
| Timeframe | StdDevLevel | Lookback | Notes |
|---|---|---|---|
| 1m | 2.5 – 3.0 | 15 – 20 | Heavy noise; prioritize confirmations (General structure). |
| 5m | 3.0 – 3.5 | 20 – 25 | Good intraday balance. |
| 15m | 3.0 – 3.5 | 20 – 30 | Filters plenty of noise; useful for more selective scalps. |
| H1 | 3.5 – 4.0 | 20 – 30 | “Cleaner” signals; lower frequency. |
| H4/D1 | 3.5 – 4.5 | 20 – 40 | Macro context, ideal as a validator. |
Adjust gradually: if you get too many zones, increase
stddevlevel; if you get too few, lower it or reducelookback.
⚖️ Delta Zones vs. advanced Order Flow #
| Feature | Delta Zones (TradingView) | Advanced Order Flow (ATAS/Bookmap/Sierra) |
|---|---|---|
| Accessibility | ✅ No level-2 data required | ❌ Requires data and premium subscriptions |
| Base data | Price + statistics | Aggressor volume by level (DOM/Footprint) |
| Learning curve | Low/Medium (immediate visual) | Medium/High (technical reading) |
| Microstructure precision | Limited | Very high |
| Platform alerts | ✅ Native in TradingView | Varies by platform |
| Cost | Low/0 | Medium/High |
Important. Delta Zones does not replace institutional Order Flow reading. It’s a statistical approximation that makes that philosophy accessible without costly infrastructure.
✅ Pros and ❌ Cons #
✅ Pros #
- Easy to configure and read.
- Alerts ready to use.
- Works across multiple timeframes.
- Useful as a filter or confirmation.
❌ Cons #
- No per-level volume: it is not a footprint.
- With ZigZag there may be repainting.
- Sensitive to low liquidity.
- Requires additional validation.
💡 Practical ideas #
- Support/Resistance: confirm whether a level shows unusual buy/sell pressure.
- Liquidity traps (false breakouts): buy pressure at highs or sell pressure at lows.
- Multi-timeframe: e.g., H4 as trigger; validate on D1/W1 with volume profile (POC), ADX (strength indicators) and oscillators.
- Risk management: use box edges as references for stop placement or invalidation.
📊 Suggested Parameters by Market #
| Market | Delta Zones – StdDevLevel | Delta Zones – Lookback | Notes |
|---|---|---|---|
| Futures (ES, GC, CL) | 3.5 – 4.0 | 20 – 25 | High liquidity → “stricter” filters. |
| Cryptocurrencies | 2.5 – 3.0 | 15 – 20 | High volatility → more sensitive parameters. |
| Forex | 3.0 – 3.5 | 20 – 30 | No centralized volume, combine with POC/ADX. |
❓ Frequently Asked Questions (FAQs) #
Does it replace Order Flow? No. It’s an accessible approximation in TradingView.
Does it work on TradingView mobile? Yes. Boxes and alerts display and notify in the app.
What if several boxes appear in a row? They reflect pressure stacking; validation with TCCI+ADX is recommended.
Can you develop it for another platform? The indicator’s code is open. You’ll need to port the logic to the target platform’s language.
🚀 Ready to try it? #
-
Open the indicator search and type:
"Delta Zones Buy/Sell Pressure". Then add it to favorites with the yellow star ⭐.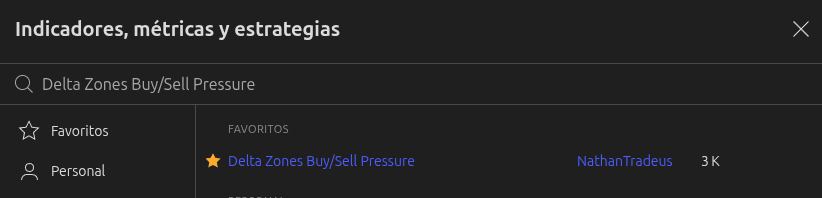
-
Open the indicator’s settings to customize borders, colors, and boxes. As an optional step, enable ZigZag to analyze historical price action and contextualize movements.
🎯 Conclusion #
“Delta Zones doesn’t predict the market; it helps you read the story behind each candle and identify imbalances that can make the difference between a rushed entry and a validated one.”
A tool that brings institutional reading within reach of any trader on TradingView. No extra cost, no infrastructure. Just analysis.